The main page of freejna admin panel that’s appear while admin user login contains a number of statistics which are graphically represented as follows :
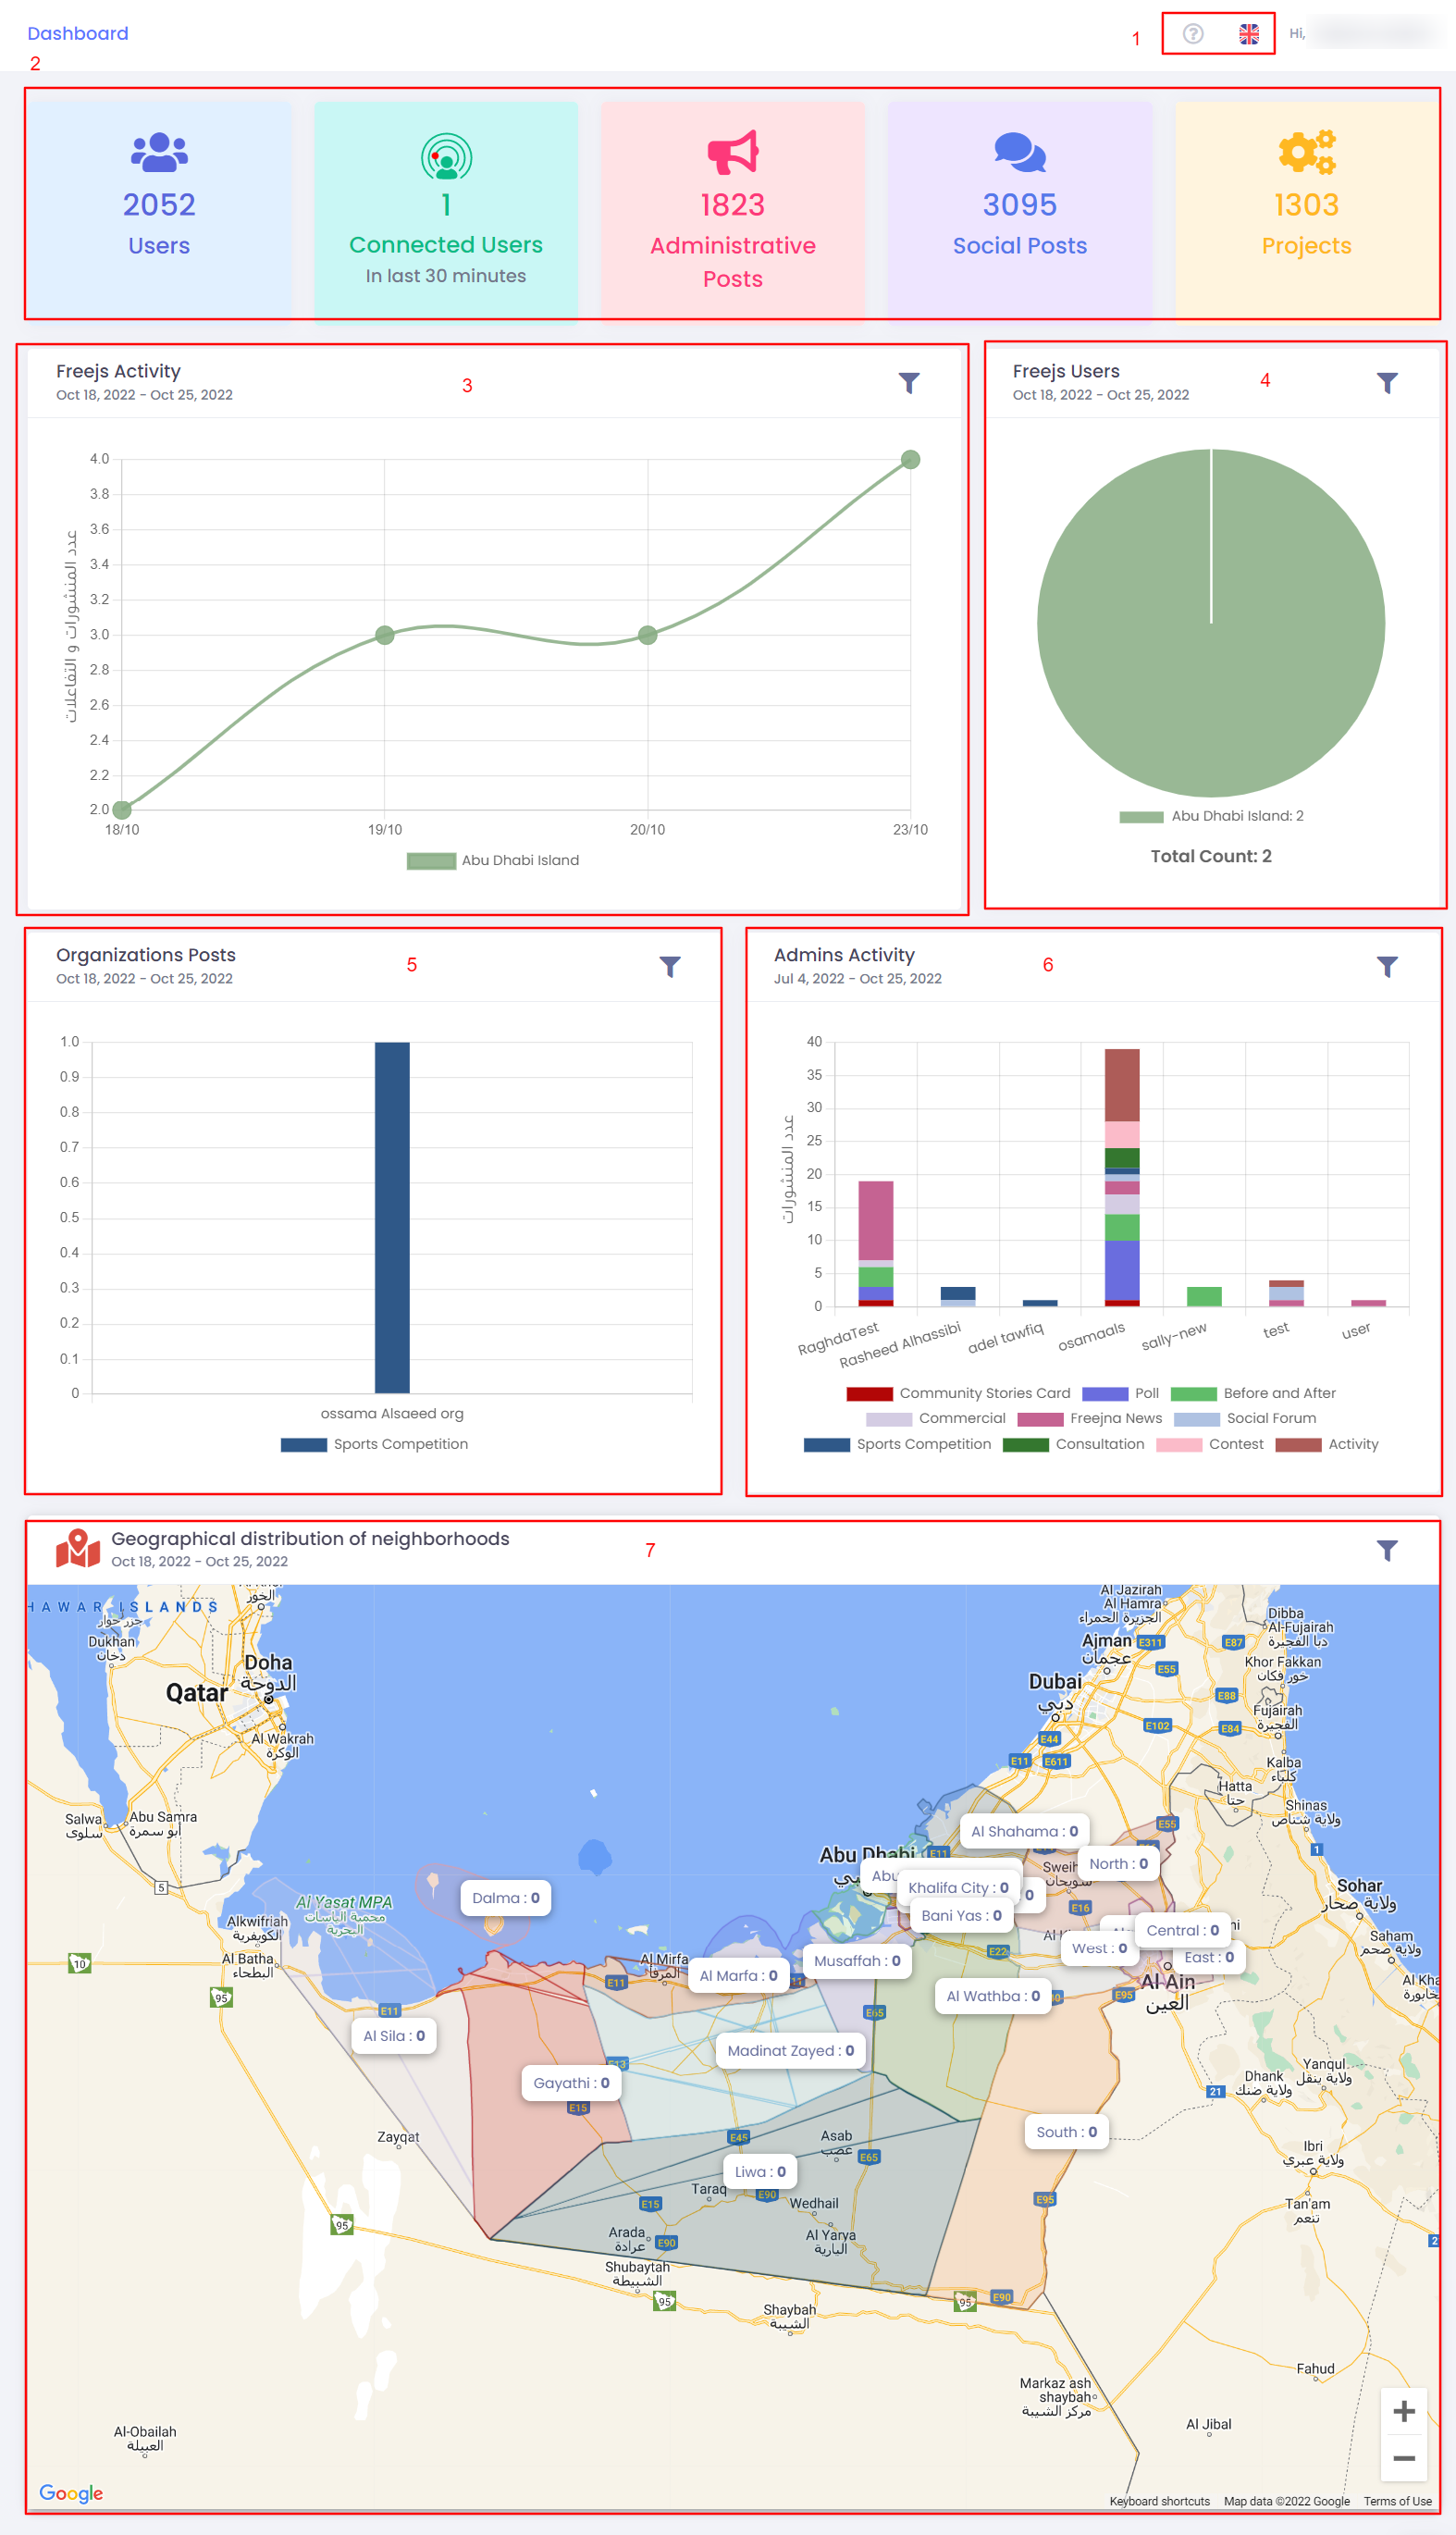
- Admin user can switch between languages (English and Arabic ) , with ? sign user can explore the dashboard Docs .

- Admin user can show four cards that represent a statistics numbers about (users, connected users. administrative posts, social posts and projects)
- Th freejs activity line graph clearly shows the count of posts depends on freejs. Admin user can filter graph result by choosing time or choosing specific freejs
- The freejs users pie chart shows the count users depends on freejs. Admin user can filter graph result by choosing time or choosing specific freejs.
- The organization posts bar chart clearly shows the published posts on different cards( activities, social forms, polls, idea challenges, majlis, Voluntary, news, announcements, contests, commercial card and before/after ) depends on the related organization.Admin user can filter graph result by choosing specific time or searching about specific organization.
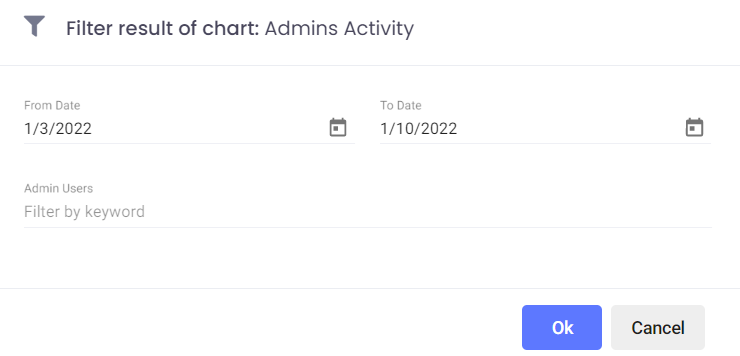
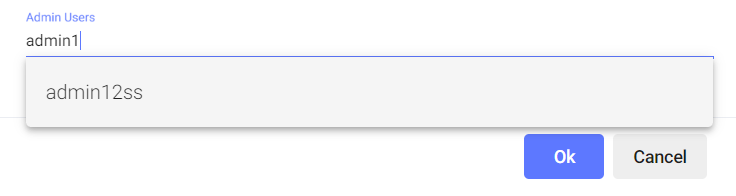
- The admins activity chart clearly shows admin users activity in the dashboard. Admin user can filter graph result by choosing specific time or searching about specific admin user.
- The admin user can view the geographical distribution of neighborhoods in the form of an interactive map, also admin can filter the results based on a specific time